写作题目:
2014年6月7日雅思写作真题解析附范文Task1
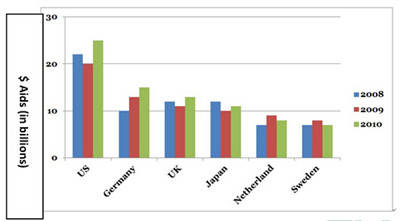
The chart below shows the aid from six developed countries to developing countries from 2008 to 2010.

写作题目分析:
今年bar第6次考到,line和table考到4次,而pie仍然只考了1次。6月份剩余考试,首先准备pie,然后是line和table。 当然更好的复习方式是熟练分析和练习动静数据两大种情况。此外流程图,特别是地图需要至少练习一篇。
写作范文参考:
This bar chart shows the amount of financial aid by six economically developed countries between 2008 and 2010, measured in billions of dollars.
US provided the most aid in all three years, and, despite a slight drop to $ 20 billion from 22 $ billion in the first year, the figure rose to $ 25 billion in 2010. Germany, UK and Japan were the other three major donors, though the average figures were only about half that of US at around $ 10 billion. While Germany continually increased their aid, making it $ 15 bill ion in 2010,the other two countries reduced their donation in 2009 before rises in 2010.


