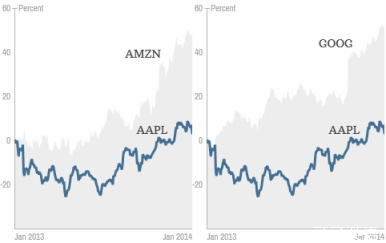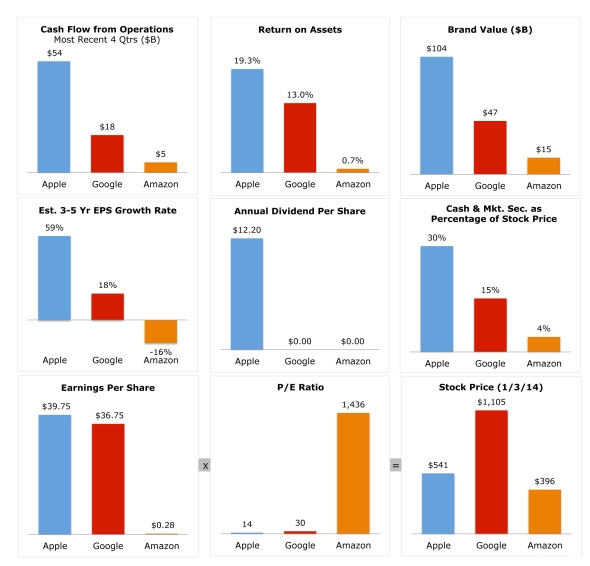
The two stock charts at right, comparing Apple's (AAPL) performance in 2013 to Amazon's (AMZN) and Google's (GOOG), tell a very different story than the nine bar charts below.
右边的两张图是2013年苹果(Apple)的股价走势与亚马逊(Amazon)和谷歌(Google)的对比,但对比结果与下面的9张柱状图相左。
Produced for Fortune by the reader who posts here as Merckel, the bar charts compare the three companies by more objective measures -- boring things like cash flow, return on assets, earnings growth and dividends paid.
这些柱状图是一位名为“Merckel”的读者提供给《财富》(Fortune)杂志的,使用一些较为客观的指标对三家公司进行了比较,包括现金流量、资产回报率、利润增长和已支付股息等枯燥的数据。
这三家公司当然拥有不同的业务模式。苹果通过溢价出售高端消费品,赚取巨额利润。谷歌每笔在线广告利润微薄,但在线广告总销量数以十亿计。亚马逊正在打造一个巨型虚拟购物中心,将现有店铺(如图书、电子产品等)的利润注入新店铺。
但股市每天要做的事就是对不同的商业模式进行定价。从Merckel的这些柱状图来看,市场似乎相信谷歌和亚马逊的增长永远没有尽头。
For Apple, it will believe it when it sees the next hit product.
至于苹果,市场还需要看到新一款轰动性的产品。


